Bitcoin is back near $64,400 on August 5, 2026, and the first instinct is to call it a recovery. The more revealing number is 57%: Bitcoin dominance has climbed to that level while the market remains in Fear. Capital is returning, but it is returning selectively. That is a recovery with a narrow door.
Current market data shows Bitcoin up roughly 1.2% over 24 hours, with daily trading volume near $23.2 billion and market capitalization around $1.29 trillion. A live market feed also shows the latest Bitcoin spot ETF headline at approximately $170 million of net inflows. The price is firming, yet Ethereum and Solana are not leading the move. August is rewarding the anchor asset first and asking altcoin traders to wait outside.
Quick Answer: Is Bitcoin bullish on August 5, 2026?
Bitcoin is cautiously bullish above $63,000, but the move becomes a confirmed breakout only above $65,500 and then $67,000. ETF demand has improved, while Fear remains elevated and dominance is rising. That combination supports a Bitcoin-led rebound, not a broad risk-on altcoin cycle.
| Market signal | Current reading | Interpretation |
|---|---|---|
| Bitcoin price | $64,400 | Near the upper half of the recent range |
| Bitcoin 24h change | About +1.2% | Short-term buyers have control |
| Bitcoin market cap | About $1.29T | Large enough to absorb meaningful flows |
| 24h crypto market volume | About $23.2B for BTC | Participation is present but not euphoric |
| Bitcoin dominance | 57.0% | Capital is concentrating in the leader |
| Fear & Greed | 27, Fear | Traders remain defensive |
The live Bitcoin figures and dominance come from CoinGecko’s Bitcoin market page. Alternative.me’s crypto dashboard shows the same broad picture: Bitcoin near $64,379, Ethereum near $1,874, Solana near $74, and a Fear reading of 27.
The ETF bid is back, but it is not broad conviction yet
The most constructive development is the return of spot ETF buying. CoinGecko’s current market news feed lists roughly $170 million of net Bitcoin ETF inflows, with BlackRock’s IBIT leading the session. That matters because the July rebound struggled whenever institutional demand disappeared. A real spot bid gives the move a better foundation than perpetual-futures leverage alone.
But one positive session does not erase the previous warning. July ended with a monthly net inflow of $172.4 million, even though the final trading day saw $265.4 million leave US spot Bitcoin ETFs. The month produced 13 inflow days and 9 outflow days. The totals were positive, but the path was unstable.
| ETF flow checkpoint | Net flow |
|---|---|
| July monthly total | +$172.4M |
| July inflow days | 13 |
| July outflow days | 9 |
| July 30 | +$233.1M |
| July 31 | -$265.4M |
| Latest market-feed inflow | About +$170M |
The historical figures are from TFTC’s July ETF flow table. The correct read is not “institutions are back” or “institutions are gone.” It is that institutions are willing to buy when price is attractive, but they have not yet shown the persistent demand needed to carry Bitcoin through the next resistance band.
That distinction is the entire August trade. If daily inflows remain above $100 million while BTC holds above $63,000, the rebound gains credibility. If inflows vanish as price approaches $65,500, the market is still trading inside a liquidity range. The ETF chart is a confirmation tool, not a magic green light.

What does 57% Bitcoin dominance mean?
A 57% Bitcoin dominance reading means crypto capital is preferring liquidity and market depth over speculation. Traders are participating, but they are not yet distributing risk evenly across the market.
Bitcoin dominance has risen even as several large-cap assets post modest gains. Ethereum is near $1,874, Solana near $74, and BNB near $603. The dashboard’s stronger movers include Zcash, Polkadot, and BNB, but the broader pattern is not a synchronized altcoin expansion. Bitcoin remains the portfolio’s first stop.
| Asset | Approximate price | 24h change | Market role |
|---|---|---|---|
| Bitcoin | $64,400 | +1.2% | Liquidity anchor |
| Ethereum | $1,874 | +1.1% | Large-cap beta, still lagging |
| Solana | $74.27 | +1.3% | Higher-beta secondary trade |
| BNB | $603.22 | +2.4% | Exchange and ecosystem exposure |
| Polkadot | $0.857 | +4.3% | Stronger short-term mover |
The trap is assuming that a rising dominance chart is automatically bullish for Bitcoin. It can also signal that traders are hiding in the safest crypto asset while reducing exposure elsewhere. Dominance becomes more constructive when it rises with total market capitalization and then begins to roll over as altcoin breadth expands. Today, the first half of that sequence is visible. The second half is not.
The range that decides August
Bitcoin’s 7-day range on CoinGecko is approximately $62,241 to $65,305. That gives traders a useful working map. The lower boundary is where buyers need to appear. The upper boundary is where the rebound must prove it can become more than a range rotation.
| Level | Function | What would confirm it |
|---|---|---|
| $62,000 to $62,500 | Demand pocket | Pullbacks hold without heavy ETF selling |
| $63,000 | Rebound line | Daily closes stay above the pivot |
| $64,400 | Current price zone | Buyers accept higher prices |
| $65,300 to $65,500 | First resistance | Spot volume expands through the 7-day high |
| $67,000 to $68,000 | Major ceiling | Breakout survives a retest |
| $70,000 to $72,000 | Bull extension | Momentum broadens beyond Bitcoin |
Recent market analysis also placed resistance around $67,000 to $68,000 and strong support near $60,000. Forbes’ July technical review cited $70,000 to $72,000 as an upside target and $60,000 as the meaningful support zone.
What invalidates the bullish setup?
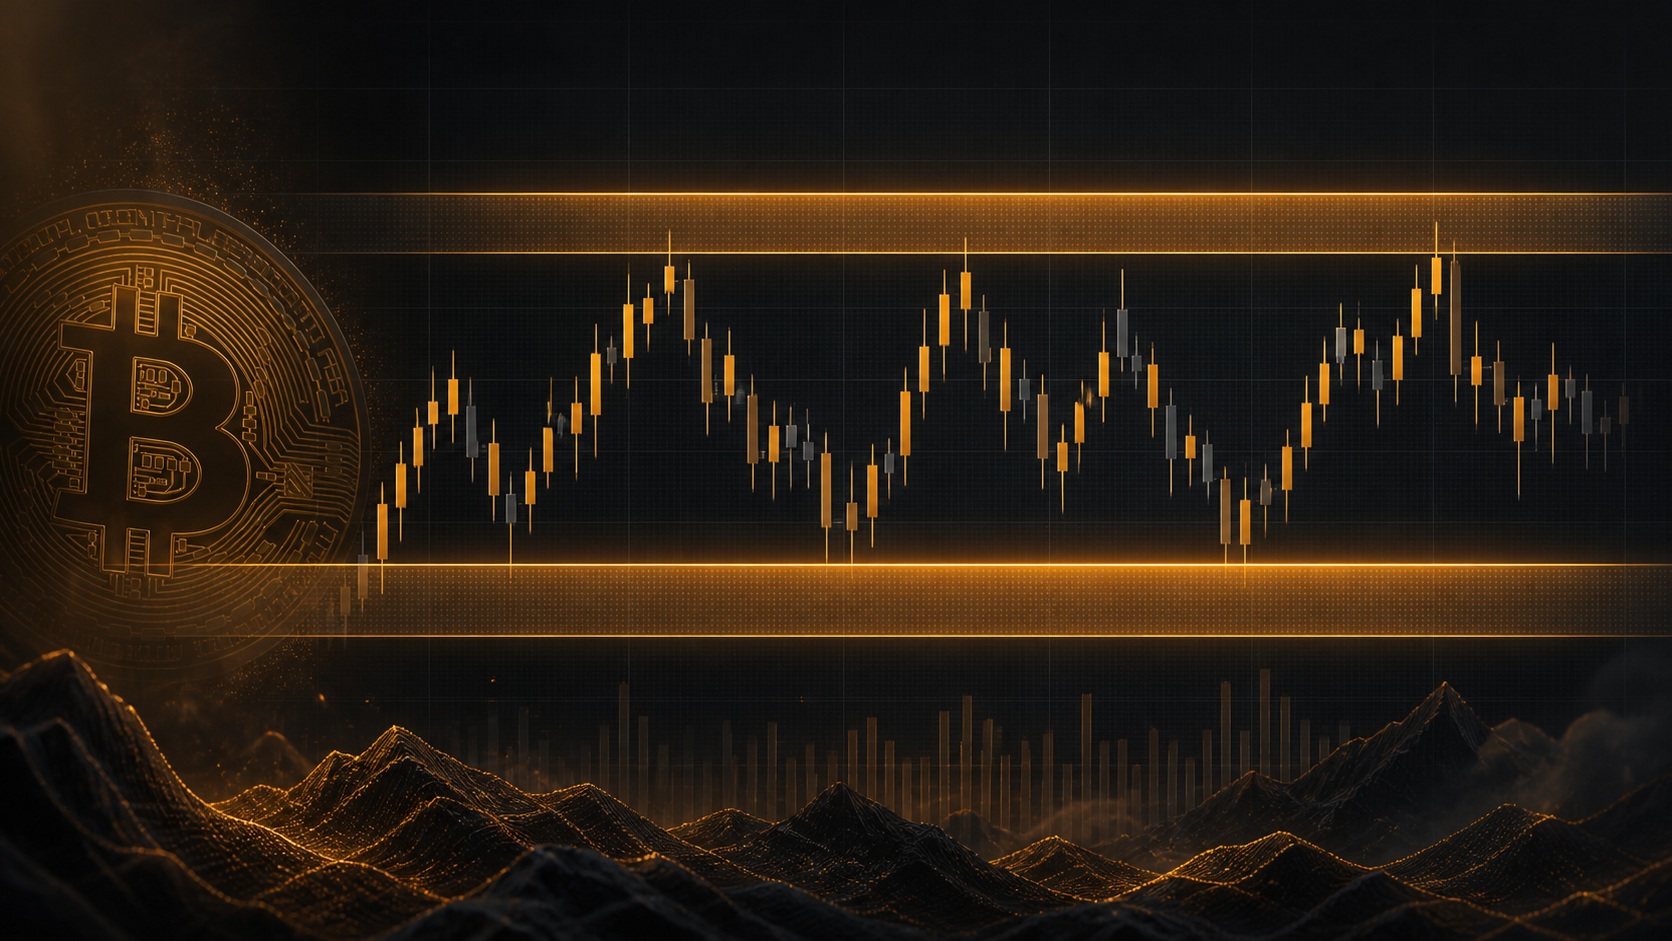
A daily close below $62,000 would weaken the immediate recovery, while a decisive break below $60,000 would invalidate the broader August rebound thesis. The distinction matters. A wick below support can be a liquidity sweep. A close below support says buyers did not reclaim the level.
On the upside, Bitcoin does not need to sprint straight to $70,000. The healthier path would be a close above $65,500, a controlled retest, and then an attempt at $67,000. If price jumps through resistance while ETF flows flatten, the move may be more fragile than it looks. Markets are fond of making the first breakout look definitive before asking for receipts.
Why Fear at 27 matters, and why it is not a signal to buy
Is Fear & Greed at 27 bullish for Bitcoin?
Fear at 27 can create a favorable contrarian backdrop, but it is not a standalone buy signal. Fear tells you positioning is defensive. It does not tell you whether forced selling is finished.
Alternative.me shows the index at 27 today, up from Extreme Fear at 25 yesterday, with last week’s reading at 29 and last month’s at 24. Sentiment has improved slightly without reaching optimism. That is useful because a market can climb a wall of skepticism, but it also means the next move will need evidence.
The evidence to watch is straightforward:
- BTC holds $63,000 on a daily closing basis.
- ETF inflows continue for more than one session.
- Bitcoin volume rises on advances rather than only during selloffs.
- Ethereum begins to outperform BTC, showing that risk appetite is widening.
- Dominance stops rising because capital is moving into quality altcoins, not because Bitcoin is falling.
Until then, Fear is a description of the market, not a trading instruction.
Binance watch: products are active, but product news is not a market thesis
Binance’s latest announcements include a $200,000 GRVT trading competition, the launch of Binance Lite Loan, and notices about spot-pair removals and changes to USDⓈ-M perpetual-contract margin tiers. These are relevant to execution and risk management, especially for users trading new contracts or borrowing against collateral.
The official Binance announcements page is the right place to check the current terms, launch times, and affected regions. A new competition can increase attention. A margin-tier change can alter liquidation risk. Neither one proves that Bitcoin will break resistance.
Trade the range without donating to fees
Range markets tempt traders into repeated small decisions. That is exactly when costs become visible. If you enter, reduce, re-enter, and hedge several times while BTC moves between $62,000 and $65,500, the market can be flat while your fee bill trends higher.
Sign up on Binance with 20% fee discount
Use referral code RATE20 for a permanent 20% discount on eligible Binance trading fees. The complete signup route is covered in Get 20% off with code RATE20. Check current eligibility and regional terms before registering.
Stack discounts before you stack positions
If this market remains range-bound, reduce execution drag before increasing trade frequency.
- 20% off: Use referral code RATE20 at signup.
- 25% off: Pay eligible fees with BNB.
- Maker discount: Prefer limit orders when the setup allows patient execution.
Under the stated assumptions, the effective cost can be as low as about 0.06% per trade. Actual fees depend on account tier, product, region, and current Binance terms.
| 30-day volume | Standard 0.10% fee | With 20% referral | Illustrative saving |
|---|---|---|---|
| $5,000 | $5.00 | $4.00 | $1.00 |
| $10,000 | $10.00 | $8.00 | $2.00 |
| $50,000 | $50.00 | $40.00 | $10.00 |
| $100,000 | $100.00 | $80.00 | $20.00 |
Start trading on Binance with maximum discount
Lower fees are not a reason to trade more. They are a reason to keep a valid setup from being quietly destroyed by friction.
The first August checklist
The next sessions should be handled as a sequence of tests:
- ETF test: Does the latest inflow become a multi-session trend?
- $63,000 test: Does Bitcoin defend the rebound pivot on weakness?
- $65,500 test: Can price clear the 7-day high with spot volume?
- $67,000 test: Does the major resistance zone convert into support?
- Dominance test: Does 57% remain elevated because BTC is strong, or because altcoins are weak?
- Breadth test: Does Ethereum start outperforming, or does Bitcoin keep absorbing the risk budget?
- Binance risk test: Do margin-tier or contract changes affect the leverage you planned to use?
Bottom line
Bitcoin at $64.4K is a credible recovery attempt, but it is still a Bitcoin-led trade rather than a full crypto risk-on event. The positive case has three pillars: the latest ETF data points to about $170 million of buying, BTC is holding above $63,000, and Fear remains high enough to leave room for a sentiment rebound.
The caution case is equally clear. July ETF flows were positive only by a narrow margin, dominance has climbed to 57%, and Bitcoin has not yet cleared the $65,500 to $68,000 resistance ladder. Until those levels break and hold, the disciplined approach is to trade the range, not invent a trend.
What is the best Binance referral code?
The best Binance referral code for this site is RATE20, which offers a 20% fee discount under the stated referral terms. Confirm current eligibility and regional availability during signup.
How much can I save with Binance referral code RATE20?
At a $10,000 monthly trading volume, the illustrative saving is about $2 before additional BNB or maker-order discounts. Actual savings depend on the account’s fee tier, product, jurisdiction, and current Binance schedule.
Is Bitcoin bullish or bearish on August 5, 2026?
Bitcoin is cautiously bullish above $63,000, but the trend is not confirmed until BTC clears $65,500 and then $67,000 with sustained spot demand. A daily close below $62,000 weakens the setup, while a break below $60,000 changes the risk profile.
Create your Binance account with 20% fee discount
Referral code: RATE20, permanent 20% off eligible trading fees under the stated terms.
This article is for informational purposes only and does not constitute financial advice. Always do your own research before making investment decisions.
Before you create an account
A final signup check, before any first trade
Binance must display SmallDrift, RATE20, and the 20% fee discount in its signup flow. If it does not, do not assume the offer will be applied after account creation.
Continue reading