Bitcoin Loses $80K: What Must Recover — October 29, 2026
Bitcoin slips below 80,000 USDT as ETH and SOL underperform. The rolling range shows why reclaiming one round number would leave the recovery unfinished.
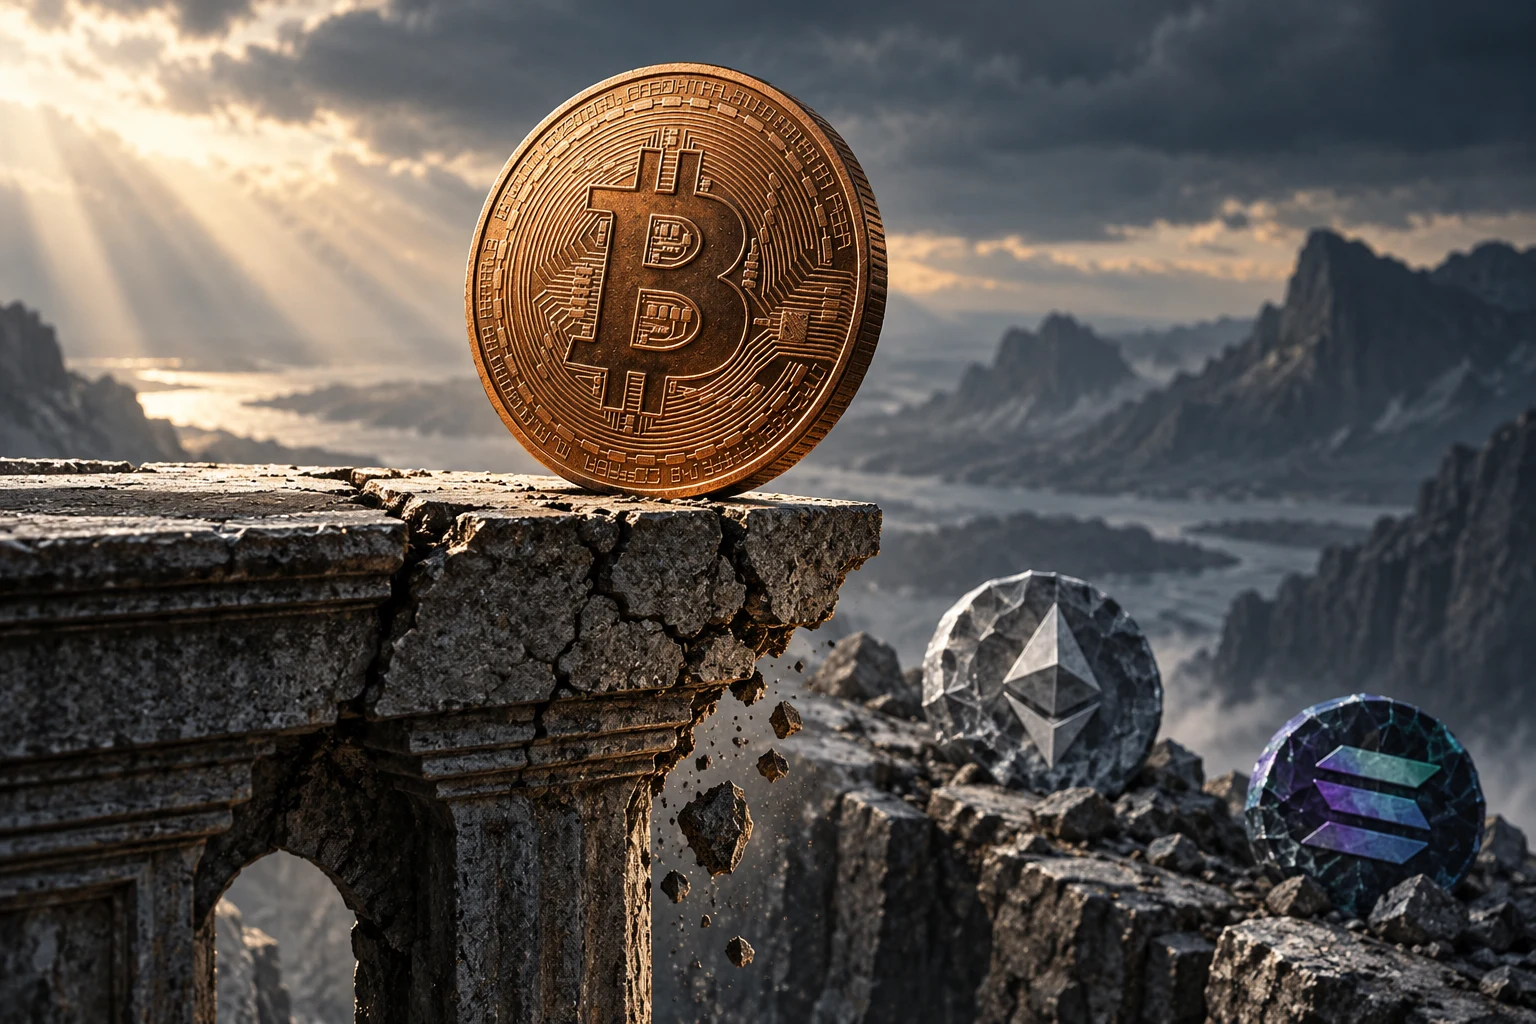
Bitcoin was only 24 USDT below 80,000, yet roughly 901 USDT below where its rolling day began. Ethereum and Solana were losing more ground in percentage terms, making the weakness broader than one round-number headline. For anyone watching a bounce, the question is whether buyers can recover the prices where the past day’s trading actually happened.
Research cutoff: October 29, 2026, at 07:01:26 UTC. Market figures below are preserved snapshots retrieved at that time. Binance prices refer to spot BTC/USDT, ETH/USDT and SOL/USDT; changes, highs, lows and volumes cover each pair’s rolling 24-hour window ending around 07:01:26 UTC, rather than a completed UTC calendar day. USDT quotes are not identical to US dollar cash prices. Linked market pages show current data and may differ from this article’s historical snapshot.
What does Bitcoin’s break below 80,000 mean?
Bitcoin was near the bottom of its observed rolling range, with most of the recovery work still overhead. At 79,976 USDT, BTC stood just 266 USDT above its 79,710 low. The period’s high was 81,823. That puts the snapshot price approximately 12.6% of the way from the low to the high.
That calculation describes location, not a probability of reversal. A market can sit near its low because sellers are running out of supply, or because buyers have not yet found a reason to step in. The ticker alone cannot tell those stories apart.
The useful distinction is between a psychological landmark and an observed trading reference. Crossing back above 80,000 would recover the landmark. Moving above the rolling volume-weighted average, around 80,860, would recover a more meaningful reference for where volume traded during this window. Neither would automatically establish a new uptrend.
The round number gets the headline. The trading range gets a vote too.
Today’s crypto market snapshot
The official Binance market overview provides a reader-friendly place to follow prices. The figures in this table come from separately preserved spot-pair ticker responses, so their volumes should not be confused with the overview’s broader coin-level totals.
| Spot pair | Snapshot price, USDT | Rolling 24h change | Rolling low–high, USDT | Pair quote turnover |
|---|---|---|---|---|
| BTC/USDT | 79,976.00 | -1.114% | 79,710.00–81,823.00 | 1.149 billion USDT |
| ETH/USDT | 2,313.66 | -1.697% | 2,293.44–2,391.55 | 495.06 million USDT |
| SOL/USDT | 100.10 | -1.930% | 99.26–103.85 | 215.87 million USDT |
Quote turnover is trading activity, not net money entering or leaving an asset. Every executed trade has a buyer and a seller. Calling 1.149 billion USDT of Bitcoin turnover an “inflow” would turn an accounting fact into a different claim entirely.
CoinGecko’s retrieved global response placed total cryptocurrency capitalization at approximately $2.696 trillion, down 3.79% over 24 hours, with about $73.34 billion in reported 24-hour trading volume. Its global update timestamp preceded retrieval by several minutes. Those aggregated figures use a different universe and pricing methodology from the three Binance pairs.
You can follow the aggregate series on CoinGecko’s global market charts. Treat the aggregate decline as context rather than a weighted average of the three rows above. Mixing venues, update times and asset coverage can produce apparently contradictory screens without proving that any single screen is broken.
Which Bitcoin price levels matter next?
The immediate references are 79,710, 80,000, roughly 80,860 and 81,823 USDT. They are observed extremes, a round number and a volume-weighted reference from this snapshot. They are not independently established multiweek support or resistance zones.

Original AI-generated conceptual illustration. The terraces are not a price chart or a forecast.
| BTC/USDT reference | Why it is on the watchlist | What would change the interpretation |
|---|---|---|
| 79,710 | Lowest trade in the captured rolling window | Continued trading below it would extend the observed downside range |
| 80,000 | Nearby psychological threshold | A brief crossing followed by rejection would leave the recovery unproven |
| About 80,860 | Rolling volume-weighted average price | Holding above it would improve price location relative to this window’s traded volume |
| About 80,877 | Opening price of the rolling window | Recovering it would erase the captured window’s decline at that reference |
| 81,823 | Highest trade in the captured rolling window | Sustained trading above it would extend the range upward |
The volume-weighted average and opening reference are only about 17 USDT apart. That makes the 80,860–80,880 area a compact recovery checkpoint in this particular dataset. It does not reveal a resting sell wall; that would require order-book evidence we have not captured.
From the snapshot price, reaching the weighted average would require roughly a 1.11% advance. Reaching the observed high would require about 2.31%. These distances are arithmetic, not targets assigned a likelihood.
Rolling references also move. As older trades leave the window, its low, high and average can change even when the newest price barely moves. Anyone revisiting this setup later should refresh the measurements instead of treating today’s table as a permanent map.
Why are Ethereum and Solana worth watching?
Both underperformed Bitcoin over nearly synchronized rolling windows, which weakens the case for a broad recovery at the cutoff. ETH’s decline exceeded BTC’s by 0.583 percentage points; SOL’s exceeded it by 0.816 percentage points.
This is a limited sample of two major altcoins. It is enough to describe their relative weakness, but not enough to declare that every altcoin is selling off or that a market-wide breadth indicator has triggered.

Original AI-generated illustration of relative market resilience; boat positions do not encode measured returns.
ETH was approximately 0.88% above its rolling low, while SOL was about 0.85% above its low. BTC was only about 0.33% above its own. That introduces a useful complication: Bitcoin had the smaller percentage loss, yet was closer to its observed low when measured as a percentage above that low.
Relative performance and range position answer different questions. The first asks which asset lost less over the window. The second asks where the latest trade sits relative to the extremes. A careful market read can hold both observations without forcing them into a single bullish or bearish slogan.
For a stronger recovery case, watch whether ETH and SOL begin participating when BTC rebounds. If Bitcoin recovers 80,000 while the other two continue making lower prices, the move would offer less evidence of improving risk appetite across this small group.
Keep execution costs separate from the market thesis
A narrow recovery can disappear into repeated entries, exits and slippage. Before placing an order, decide what price behavior would invalidate the setup and how much capital would be exposed. A lower commission cannot repair an undefined exit.
If you choose to open an eligible Binance account, the signup link pre-applies RATE20. Check the referral benefit and applicable terms shown during registration; availability and fee treatment can vary by account and region.
Register on Binance with referral code RATE20 →
For the site’s explanation of the advertised offer, see Get 20% off with code RATE20. Confirm the displayed terms before relying on a particular discount. This is a referral link, and SmallDrift may receive a commission.
ETF flows and whales: the missing confirmation
ETF demand and large-holder activity could help explain a recovery, but they need their own evidence. This article does not assign an October 28 ETF inflow or outflow total: research surfaced inconsistent totals, and a complete, reconciled fund-by-fund result was not established for publication.
Farside Investors’ Bitcoin ETF flow table is the relevant place to check reported US spot-fund creations and redemptions. ETF sessions are tied to US trading days; they should not be silently aligned with a rolling crypto window ending early in the UTC morning.
Even a confirmed positive ETF session would not prove that funds bought this specific dip. Its timing and coverage differ from an exchange ticker. Similarly, a large on-chain transfer would need wallet attribution and transaction context before it could support a claim that a whale was accumulating rather than moving custody.
There is no verified whale accumulation total in the captured research. Leaving that blank is more useful than filling it with an impressive number that answers the wrong question.
Binance news: incentives are not market demand
Binance’s Season 8 spot trading tournament announcement listed an end time of October 29 at 10:00 UTC. That was still ahead of this article’s cutoff. The announced pool was up to 400 BNB in token vouchers, with PEPE/USDC and AI/USDT identified as eligible pairs.
This is an exchange promotion, not an explanation for BTC, ETH or SOL price action. The pair coverage matters: activity incentivized in one set of markets cannot automatically be cited as evidence of stronger demand in another.
Reward eligibility, trading thresholds and regional restrictions also matter. Readers should evaluate any campaign against expected fees and price risk rather than treating a prize pool as free return. No tournament participation is required to understand or monitor the market setup described here.
A practical checklist for the next market update
The next observation should test today’s interpretation rather than simply find a new headline for the same price.
- Price location: Can BTC reclaim 80,000 and then the refreshed weighted-average area?
- Downside extension: Does the captured 79,710 low survive, or does trading establish a new lower range?
- Participation: Do ETH and SOL improve alongside BTC, or keep underperforming?
- Evidence quality: Are ETF figures complete and dated, and are whale claims tied to identifiable transactions?
- Execution: Does the expected move still make sense after fees, spread and potential slippage?
These checks support conditional decisions. They do not justify assuming the next candle will follow the most attractive scenario. In a weak range, waiting for additional evidence is itself a legitimate choice.
Frequently asked questions
Is 80,000 USDT confirmed Bitcoin support?
No. It is a psychological reference that Bitcoin was trading slightly below at the cutoff. The captured rolling low was 79,710. Establishing durable support would require more evidence about repeated tests and subsequent trading behavior than a single ticker response supplies.
Why did Ethereum and Solana fall more than Bitcoin today?
The captured data establishes their larger declines, but does not identify a single cause. ETH fell 1.697% and SOL 1.930%, compared with BTC’s 1.114%. Positioning, liquidity and asset-specific news could contribute, but the ticker snapshots do not isolate those effects.
What would make Bitcoin’s recovery more convincing?
Recovery above the refreshed volume-weighted average, alongside stronger ETH and SOL participation, would improve the evidence. A move through the captured high of 81,823 would extend the observed range upward. These remain conditional observations, not guarantees of continuation.
Create a Binance account with RATE20 →
Referral code RATE20 is pre-applied. Review the benefit displayed at signup and the fees applicable to your account before registering or trading.
This article is for informational purposes only and does not constitute financial advice. Always do your own research before making investment decisions.
Get 20% Off Binance Trading Fees with RATE20
New to Binance? Open the official signup page with RATE20 already applied for a 20% trading-fee discount. You do not need to copy or type the code. Review the referral details before completing registration.
- Referral code: RATE20, pre-applied by this link
- Fee discount: 20%, shown on the Binance signup screen
- Additional rewards: Check Binance for current promotions and regional availability
Be wary of unofficial referral offers promising benefits they cannot show. The Binance signup screen lets you check the code and fee discount directly.
Compare Binance fees and available discounts →
SmallDrift may earn a commission when you sign up through this link. Trading involves risk, including loss of capital.
Related Articles

Explore Related Guides
Daily Crypto Market News
Follow Bitcoin price moves, major altcoins, and the events shaping the market.
Bitcoin ETF Flows Guide
Understand ETF inflows and outflows, and how to read them alongside price action.
Binance Fee Calculator
Learn how to estimate trading costs with referral and BNB discounts.
Verified Binance Referral Guide
See how RATE20 is applied and what to check on the Binance signup screen.